Mika Kortelainen
Mika Kortelainen is Co-Founder and CEO of Mineralytics. He holds a Master’s degree in Economics and brings a broad background spanning technology, analytics, leadership and business. He came to the mining industry from the outside, and hasn’t looked back.
Mining, from a distance, looks simple. Find metal in the ground. Dig it up. Sell it. Money here, hole there, everyone goes home.
Up close: the industry spends billions and, at its worst, turns ponds into lakes, digging up rocks it hasn’t properly looked at.
That sounds unfair to an industry full of geologists, so let’s be precise. It knows roughly what’s in the ground - the assay says so. But the gap between roughly and exactly is where the write-downs and the toxic lakes come from, and the gap has a specific, measurable cause.
Elements versus minerals
Every deposit has an assay: so much nickel, so much sulphur. It drives valuations and financing rounds, and it tells you surprisingly little, because the number doesn’t act - the mineral holding it does. Five percent sulphur can be gypsum or it can be pyrite; the assay line reads the same, and one of them makes acid for fifty years. The industry knows this, which is why mineralogical analysis exists. The question is how good that analysis actually is.
Guesswork with a stamp
Here is what standard mineralogical analysis looks like in practice. A sample is measured, commonly by laboratory X-ray diffraction. Software proposes candidate minerals, often many that fit the data roughly equally well. The expert selects the combination that makes geological sense, and the report comes back with percentages to two decimal places.
There is a number for how well a chosen mineral list actually fits the measured data. Crystallographers call it Rwp; lower is better. In our work building analysis systems on thousands of diffraction patterns, we see this constantly: when measurement quality is mediocre, entire minerals can be swapped in and out of the list and the fit barely changes. Many minerals simply look alike at low resolution.
If three different answers fit your data equally well, you don’t have an answer. You have a favourite.
Geological plausibility is a legitimate constraint, and experts reach for it because the data alone can’t decide. But it means many routine reports carry a precision they don’t possess - and an orebody’s expensive surprises are, by definition, the things nobody expected. This concerns the industry regardless of whose instruments or services anyone buys.
That is a strong claim. So let’s stop asserting and start measuring. For the purposes of this post, we ran simulations on public source data only - so you can see for yourself if you like.
Case one: fool’s nickel
Pentlandite is the mineral every nickel operation is built around. Violarite is what pentlandite weathers into near the surface: the same nickel in the assay, but it responds poorly to the flotation process that pays for the mine[1].
We built a test ore from measured reference patterns (RRUFF database: pyrrhotite and pyrite as the host, pentlandite at 3 wt%)[2] and asked: if the analysis claims the wrong nickel mineral, how loudly does the data object? Violarite has no public measured reference - it is too rare - so its pattern is computed from its published crystal structure[3].
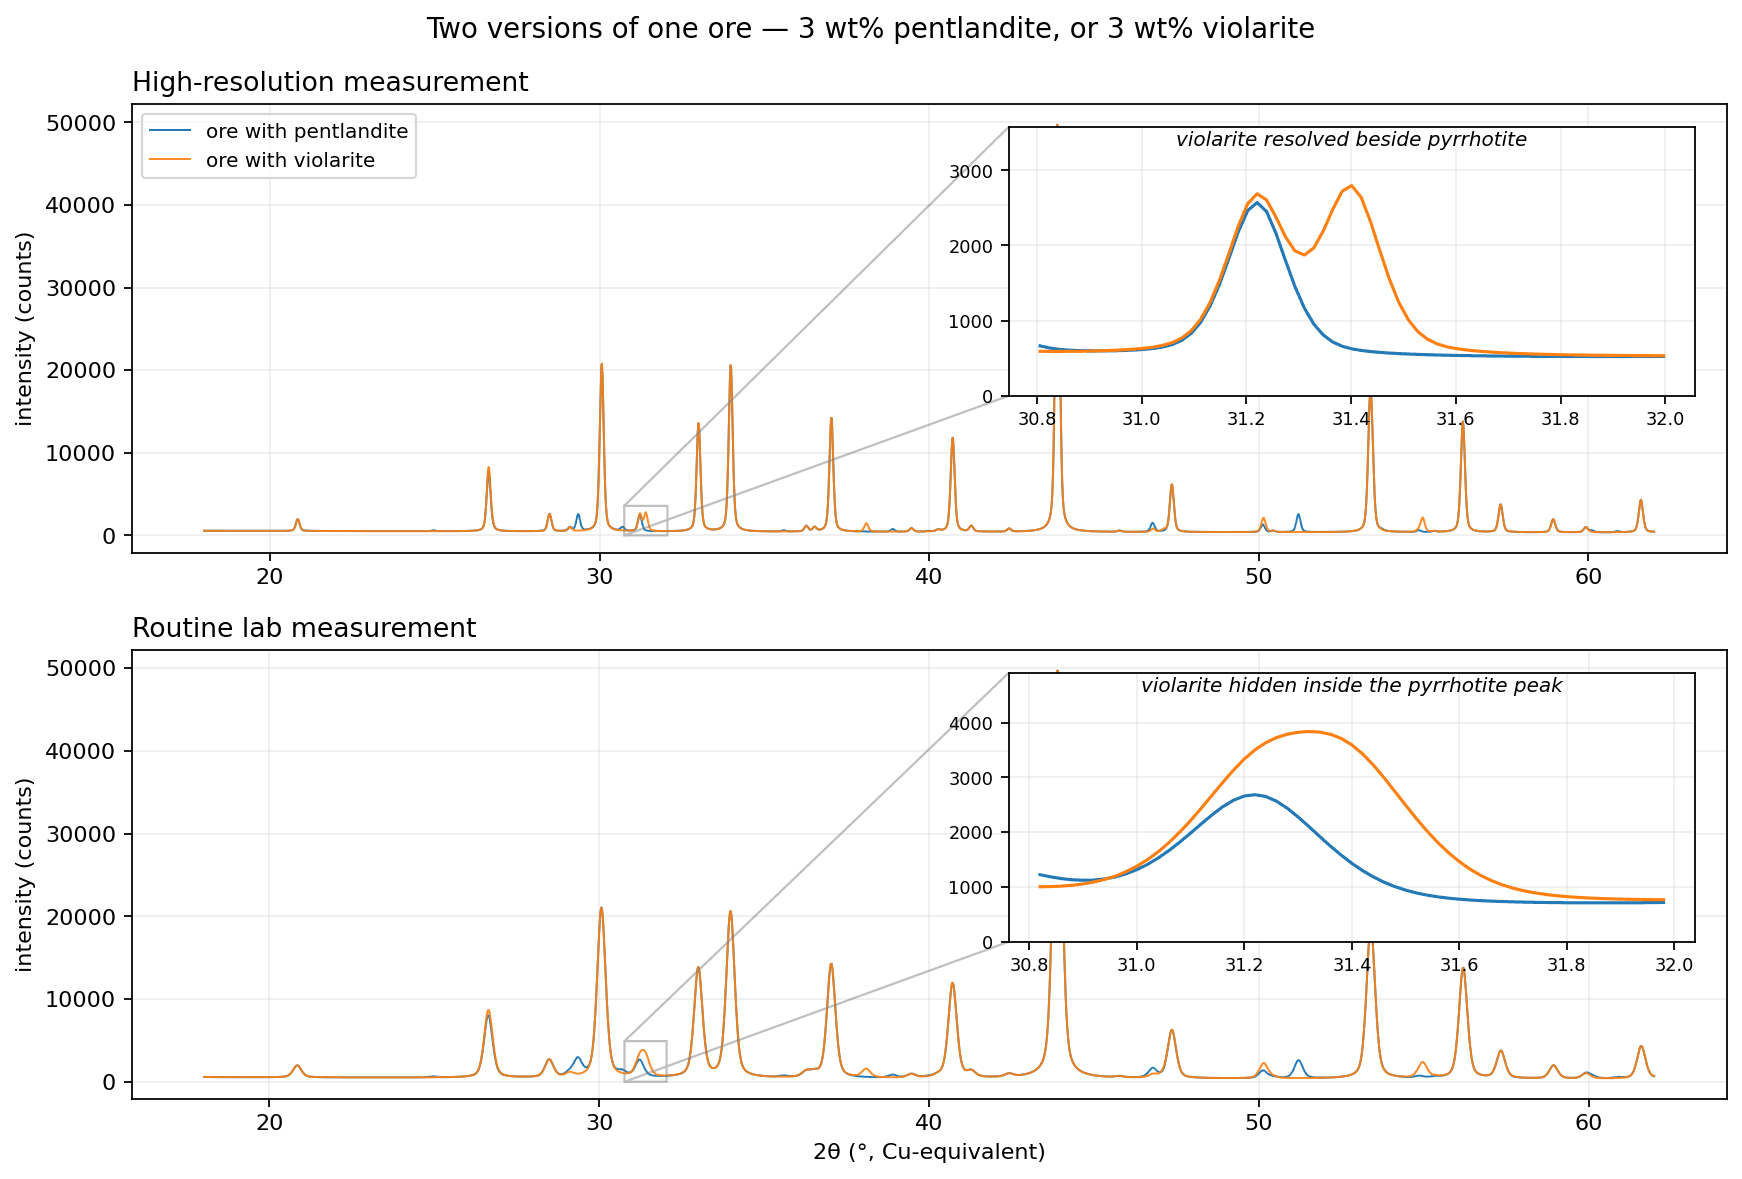
At high resolution the violarite is unmistakable: its peak stands separate, right beside pyrrhotite’s. At routine lab resolution the two merge into one, and the bad nickel mineral does something worse than disappear - it impersonates the harmless neighbour. The analysis reads a little extra pyrrhotite, which nobody questions, and the nickel is booked as pentlandite. In our reproducible swap test on reference patterns, the numbers agree: at high resolution, refining the wrong nickel mineral is penalized 41% in fit quality; at lab peak widths the penalty is zero. Not small - zero.
Resolution has its own limit, though, and honesty requires stating it: it decides identity where the phase carries enough intensity. Drop a phase toward trace level and even the best data goes quiet - the global fit number stops responding to the swap, and identity shows up only in subtler places, like the refined weight of the wrong mineral collapsing toward zero. High resolution moves the wall; it does not remove it.
In Caveman-terms: rock has nickel. Report says the good nickel. Rock full of the bad nickel. Everyone finds out at the flotation plant, which is the most expensive place on Earth to find things out.
Case two: false dolomite
Dolomite and ankerite are not two minerals so much as two names on a continuum: iron replacing magnesium in the carbonate lattice, sliding from dolomite toward siderite. We simulated a rock containing both - 40% dolomite, 40% ankerite - and measured how each instrument class sees it[4].
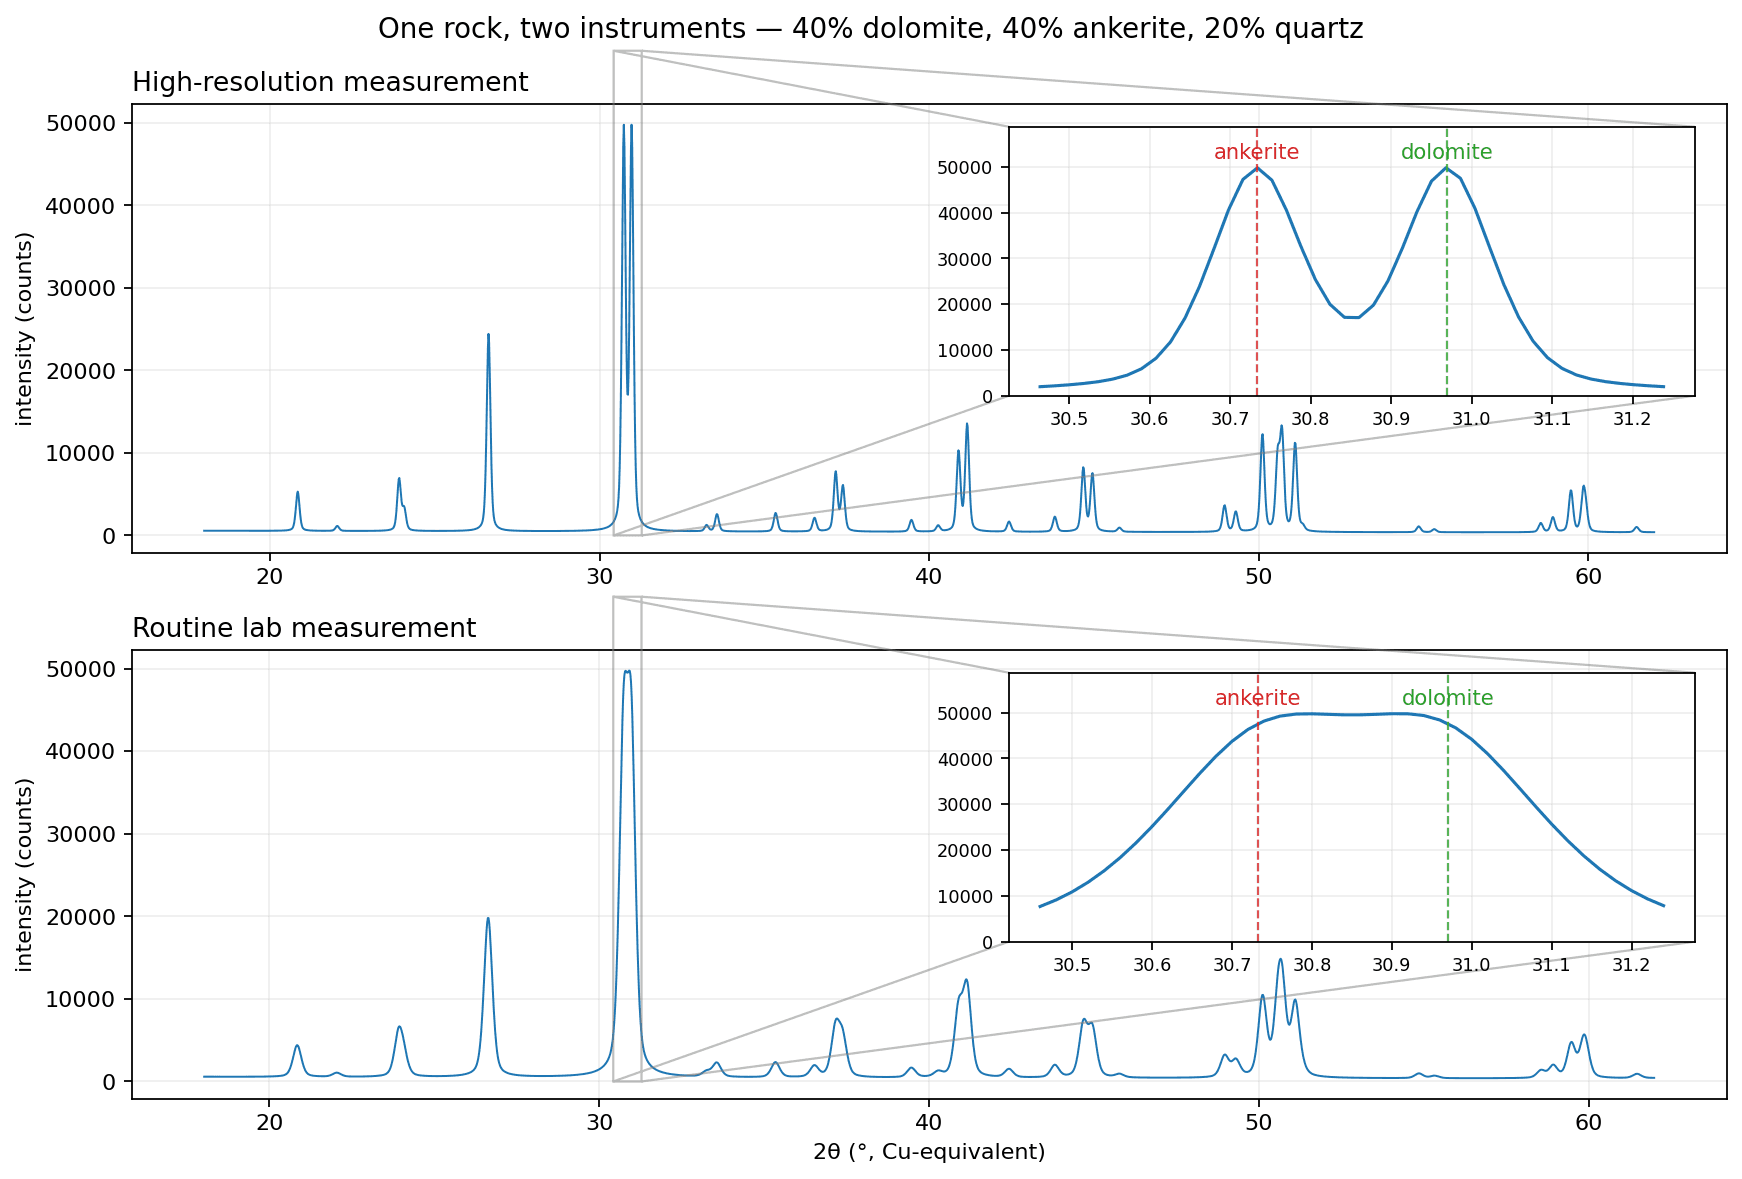
The figure shows a strongly ferroan ankerite, where the peak separation is at its largest - and lab resolution merges it into dolomite anyway. Closer to the dolomite end of the continuum the separation shrinks further, so the merging begins earlier: lab data loses the continuum from the start, and the neutralization capacity does not wait for the peaks to move - it degrades from the first substituted iron. The iron decides whether the mineral genuinely neutralizes acid mine drainage or hands the acidity back through oxidation: iron-bearing carbonates provide slow, partial, or in the siderite limit essentially no net neutralization[5]. Waste-rock classification and closure planning lean on neutralization credits; a credit computed as if the carbonate were dolomite, when it sits well down the iron continuum, overstates the protection on paper. The error surfaces years later, in the water.
Chemical assay sees the iron but not which mineral holds it. Routine diffraction sees the carbonate but not its iron. Only high-resolution diffraction reads both at once; the peak position itself carries the iron content.
On a normal instrument the two are the same squiggle. The safety plan gets built on the squiggle.
In both cases, routine data doesn’t refuse to answer - it agrees with whatever it’s told.
The hard cases
Look-alikes are one failure mode. The field has harder ones, and they follow the same logic.
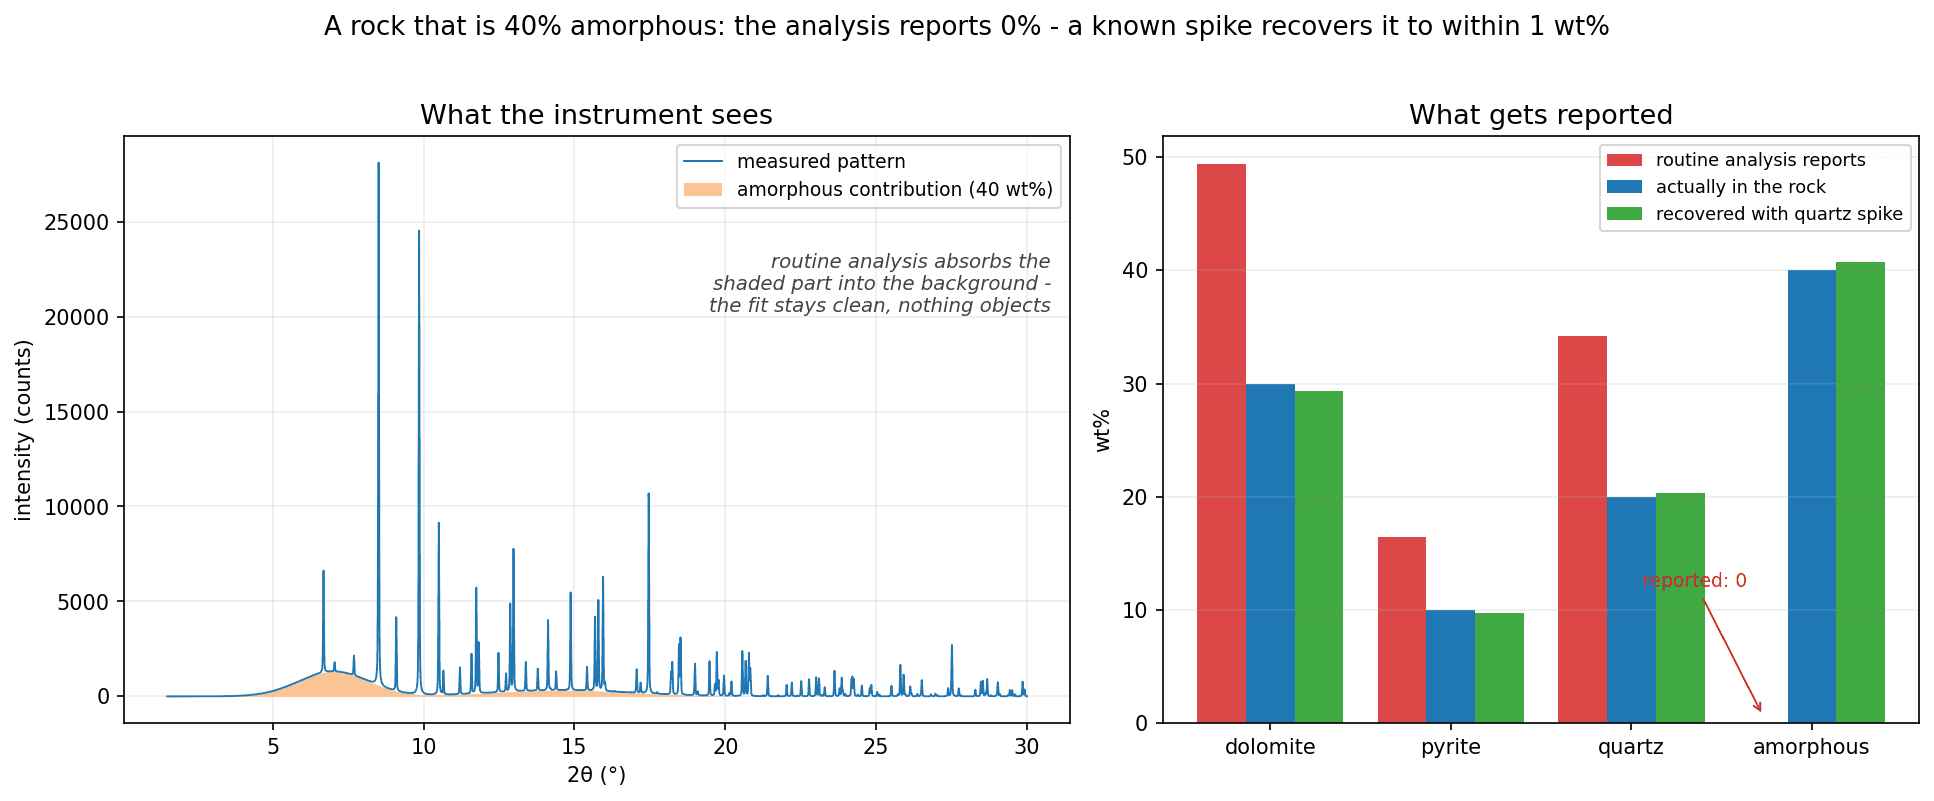
Amorphous matter. Diffraction sees crystals. Glassy phases, organic matter and poorly ordered material produce no sharp peaks - only a broad hump that routine analysis quietly absorbs into the background. We simulated a rock that is 40% amorphous and refit it the routine way: the analysis reported the three crystalline phases renormalized to 100%, dolomite at 49% instead of its true 30%, and nothing in the fit flagged the missing mass. Sample preparation adds its own version of the problem: grind a sample too aggressively and the mill creates amorphous material that was never in the rock. The remedies are known - gentler preparation, and spiking samples with a known standard: in the same simulation, a 20% quartz spike recovered the amorphous fraction to within one weight percent. But they have to be designed into the workflow, not assumed.
Some other examples:
Clays. Fine-grained, disordered, interstratified, and prone to preferred orientation: clays are the minerals routine powder diffraction quantifies worst. They are also the minerals that control slurry behaviour, flotation, dewatering and tailings stability. The phases that decide whether a plant runs are the ones the standard method is least sure about.
Talc. A soft, naturally floating mineral that contaminates concentrates and draws smelter penalties - and whose correct identification sits next to the industry’s most litigated mineral question:
Asbestos. Distinguishing asbestiform amphiboles from their harmless polymorphs is a resolution question with legal and human consequences. Here a merely uncertain answer is already a problem: an operation cannot manage, permit or defend what its analysis cannot pin down.
None of these are exotic. They are ordinary rocks, met on ordinary projects, and each one turns the same screw: the minerals that matter most are the ones routine analysis handles worst.
The other half of the problem: you can’t afford to look
Everything above assumed the sample gets analyzed at all - too often, it doesn’t.
Conventional mineralogical analysis is slow and expensive per sample. Turnaround for a serious characterization campaign is measured in months. So in the meeting where the exploration or feasibility budget gets set, mineralogy is a line to scope down. Nobody decides to gamble. The decision is phrased as discipline: we don’t have time or money for everything, we’ll do as much as we can, we’ll be as responsible as we can. And with that sentence, the corner-cutting is embedded in the project. From then on, the deposit is known through a handful of samples, and every plan downstream inherits the assumption that those samples speak for millions of tonnes.
They speak for the average. They cannot speak for the tails: the altered zone, the iron-rich carbonate pocket, the horizon carrying the penalty element. Mining’s expensive surprises live in the tails. Sparse sampling doesn’t shrink your knowledge proportionally; it deletes the tail where the risk lives.
Pilot programs are studied carefully and honestly - and no pilot-scale campaign can represent the variability of hundreds of millions of tonnes of ore. The failure is not in the answers. It is in how few questions the economics allow anyone to ask.
This is where the technology shift matters twice. Beyond sharpening each answer, synchrotron-based measurement changes the arithmetic of looking: measurement throughput of up to 10,000 samples per day, per-sample cost cut at least in half, and analysis turnaround falling from weeks or months to days or hours. When looking costs half as much and answers arrive a hundred times faster, the prudent decision in that same budget meeting flips. Characterizing the whole orebody, mapping its variability instead of spot-checking its average, stops being the irresponsible luxury and becomes the cheap insurance.
In Cavemanish: can’t find what you never looked at. And looking used to cost too much, so mostly, nobody looked.
Precision decides whether each answer can be trusted. Coverage decides whether you asked enough questions to catch the surprise. The industry has been short on both for the same understandable reason, and that reason has now expired.
A governance problem
The industry’s measurement infrastructure fails on two axes at once. Each answer is less certain than its decimal places claim, and there are too few answers to catch the variability that matters. Both failures concentrate where the risk is: low-abundance phases, complex assemblages, waste prediction, the unsampled tails of the orebody. The gap is bridged by expert judgment - unrecorded, unauditable, and under commercial pressure to reach a conclusion.
The financial consequences are familiar. Feasibility studies overrun capital budgets by a quarter on average, with no improvement in fifty years[6], and the softest inputs are recovery assumptions: mineralogy numbers. BHP approved Ravensthorpe at $1.3 billion and wrote off $1.2 billion within about a year of start-up when the plant met ore it wasn’t designed for[7].
But capital losses are, at least, recoverable in kind. The environmental version of the same measurement gap is not. Acid drainage from misclassified waste runs for decades to centuries. Contaminated watersheds are not restored by bankruptcy proceedings. The liability outlives the company and lands on the public - as Finland learned at Talvivaara, where a failing leach process ended as a torn pond liner, contaminated lakes, and a bankruptcy estate that could not carry the cleanup. The industry counts its losses in write-downs; the full orebody-count includes the lakes. And the minerals that decide these outcomes are precisely the minor, look-alike phases that routine analysis fits within noise.
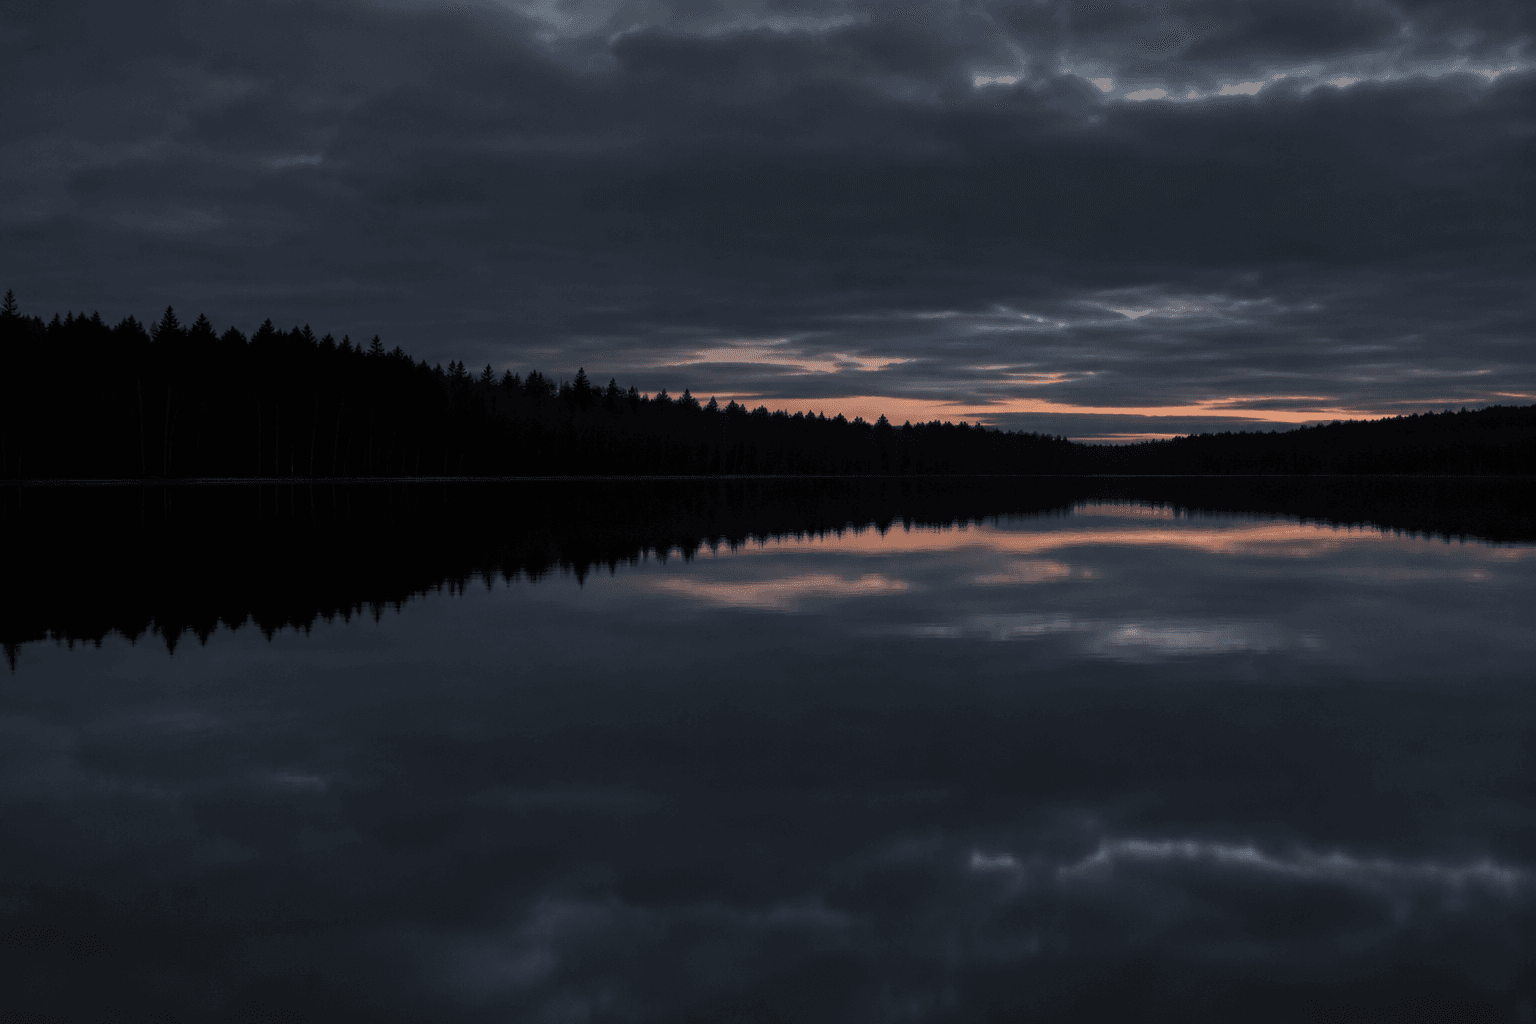
AI generated illustration of how a Finnish scenery used to look like
An industry making irreversible, third-party-bearing commitments on measurements that agree equally well with the safe answer and the unsafe one has more than a quality issue. Other industries would call it operating outside the safety case.
The industry digs first and finds out later, and “later” is sometimes a new lake that you should not swim in.
What better looks like
The fix has two parts.
The first is better measurement. High-resolution diffraction, synchrotron-class instruments among them, restores the fine structure that separates look-alike minerals and lifts minor phases above the detection floor. Modern pipelines make it fast enough to map variability across an orebody rather than spot-check it. But better measurement shrinks the ambiguous zone; it does not eliminate it. At trace abundances the pattern data is agnostic at any resolution, and something else has to carry the identification.
Better data alone doesn’t finish the job, because some ambiguity is geological, not instrumental. Experts resolve those cases with geology: violarite belongs to the weathered transition zones above primary ore, in the company of telltale minerals[8]; ankerite is characteristic of specific alteration settings. That knowledge is correct, and it is exactly what should decide. Today it decides invisibly, inside one person’s judgment, and leaves no trace in the report.
So the second fix is making the reasoning explicit. Every mineral in an analysis should carry its justification: identified by pattern fit at this confidence, or disambiguated from its look-alike because the alternative doesn’t coexist with the observed assemblage, or because it is essentially unknown in this geological setting. The same evidence as before, now on the record.
No company would accept financial statements whose method was “the accountant chose figures that seemed plausible.” Mineral lists supporting nine-figure investments and environmental permits deserve the same standard: not just an answer, but an auditable reason why this mineral and not its double.
None of this replaces certified assays, which are required and worth the wait. The point is everything decided meanwhile: drilling programs, feasibility gates, flowsheets, water and waste plans. Those decisions get made either way. The question is whether they rest on measurement or on plausible guesswork with a stamp.
Mineralytics provides quantitative mineralogical analysis using SR-XRD, alongside phase identification and Rietveld analysis from conventional XRD data. If you have a mineralogy question, get in touch.
Methods and references
Methods note. The figures are simulated by our analysis engine’s forward model from public reference structures (entry sources documented per phase), at our measured instrument resolution for the high-resolution panels and a stated routine-lab scenario (0.30 deg FWHM, Cu radiation) for the lab panels; curves are shown noise-free, and each high-resolution composite was blind-refit by the engine’s own solver, recovering every phase within tolerance. The ankerite positions use its published cell parameters. The swap-test numbers quoted in the text come from an independent, fully reproducible analysis on public data: measured reference patterns from the RRUFF database (dolomite R040030, ankerite R050197, pentlandite R060144, pyrite R050190, pyrrhotite R060440) and Crystallography Open Database structures where no public measurement exists (violarite), degraded by Gaussian convolution with matched counting statistics, refined with free phase fraction, lattice dilation, zero shift and background. All inputs are public; scripts available on request.
- Xia et al., “Experimental Study of the Transformation of Pentlandite/Pyrrhotite to Violarite” (supergene violarite floats poorly): researchgate.net/publication/242107787
- RRUFF database (measured patterns): rruff.info - pyrrhotite R060440, pyrite R050190, pentlandite R060144
- Violarite structure: Crystallography Open Database COD 9000978 - crystallography.net/cod
- RRUFF dolomite R040030, ankerite R050197 (measured); low-iron ankerite computed from COD 9001245
- Skousen et al. 1997 on siderite and NP overestimation: researchgate.net/publication/250106710 ; Stewart et al. 2006, “Advances in ARD Characterisation of Mine Wastes”: asrs.us ; GTK mine closure guidance on carbonate NP (Kauppila): mineclosure.gtk.fi
- Feasibility overrun compilation (Bullock, 258 projects, avg. 26% capital overrun): miningdoc.tech
- DBRS on BHP’s $1.2bn Ravensthorpe write-down, Jan 2009: dbrs.morningstar.com/research/226315
- Nickel, Ross & Thornber 1974, “The Supergene Alteration of Pyrrhotite-Pentlandite Ore at Kambalda”, Economic Geology 69(1): doi.org/10.2113/gsecongeo.69.1.93
Talvivaara accident investigation (gypsum pond, official report): Onnettomuustutkintakeskus Y2012-03 — turvallisuustutkinta.fi