SR-XRD
Synchrotron XRDMineralogy
Mineralogical analysis from ground samples to quantitative mineralogy. We measure at synchrotron light sources with our beamline partners and quantify every phase on Mintti, our own analysis system, for the whole programme: thousands of samples measured in a day, analysed in days, at a resolution laboratory XRD cannot reach.
Synchrotron X-ray diffraction mineralogy is quantitative XRD measured at a synchrotron, a particle accelerator used as an X-ray source, instead of a laboratory diffractometer. Ground samples are measured in seconds each with far higher intensity and angular resolution, then every mineral phase is identified and quantified. The same method appears under several names: SR-XRD, S-XRD, synchrotron XRPD or SR-XRPD, and high-throughput or high-resolution synchrotron powder diffraction.
How SR-XRD Works for Mining
01 Synchrotron
What a synchrotron is, and what it is not
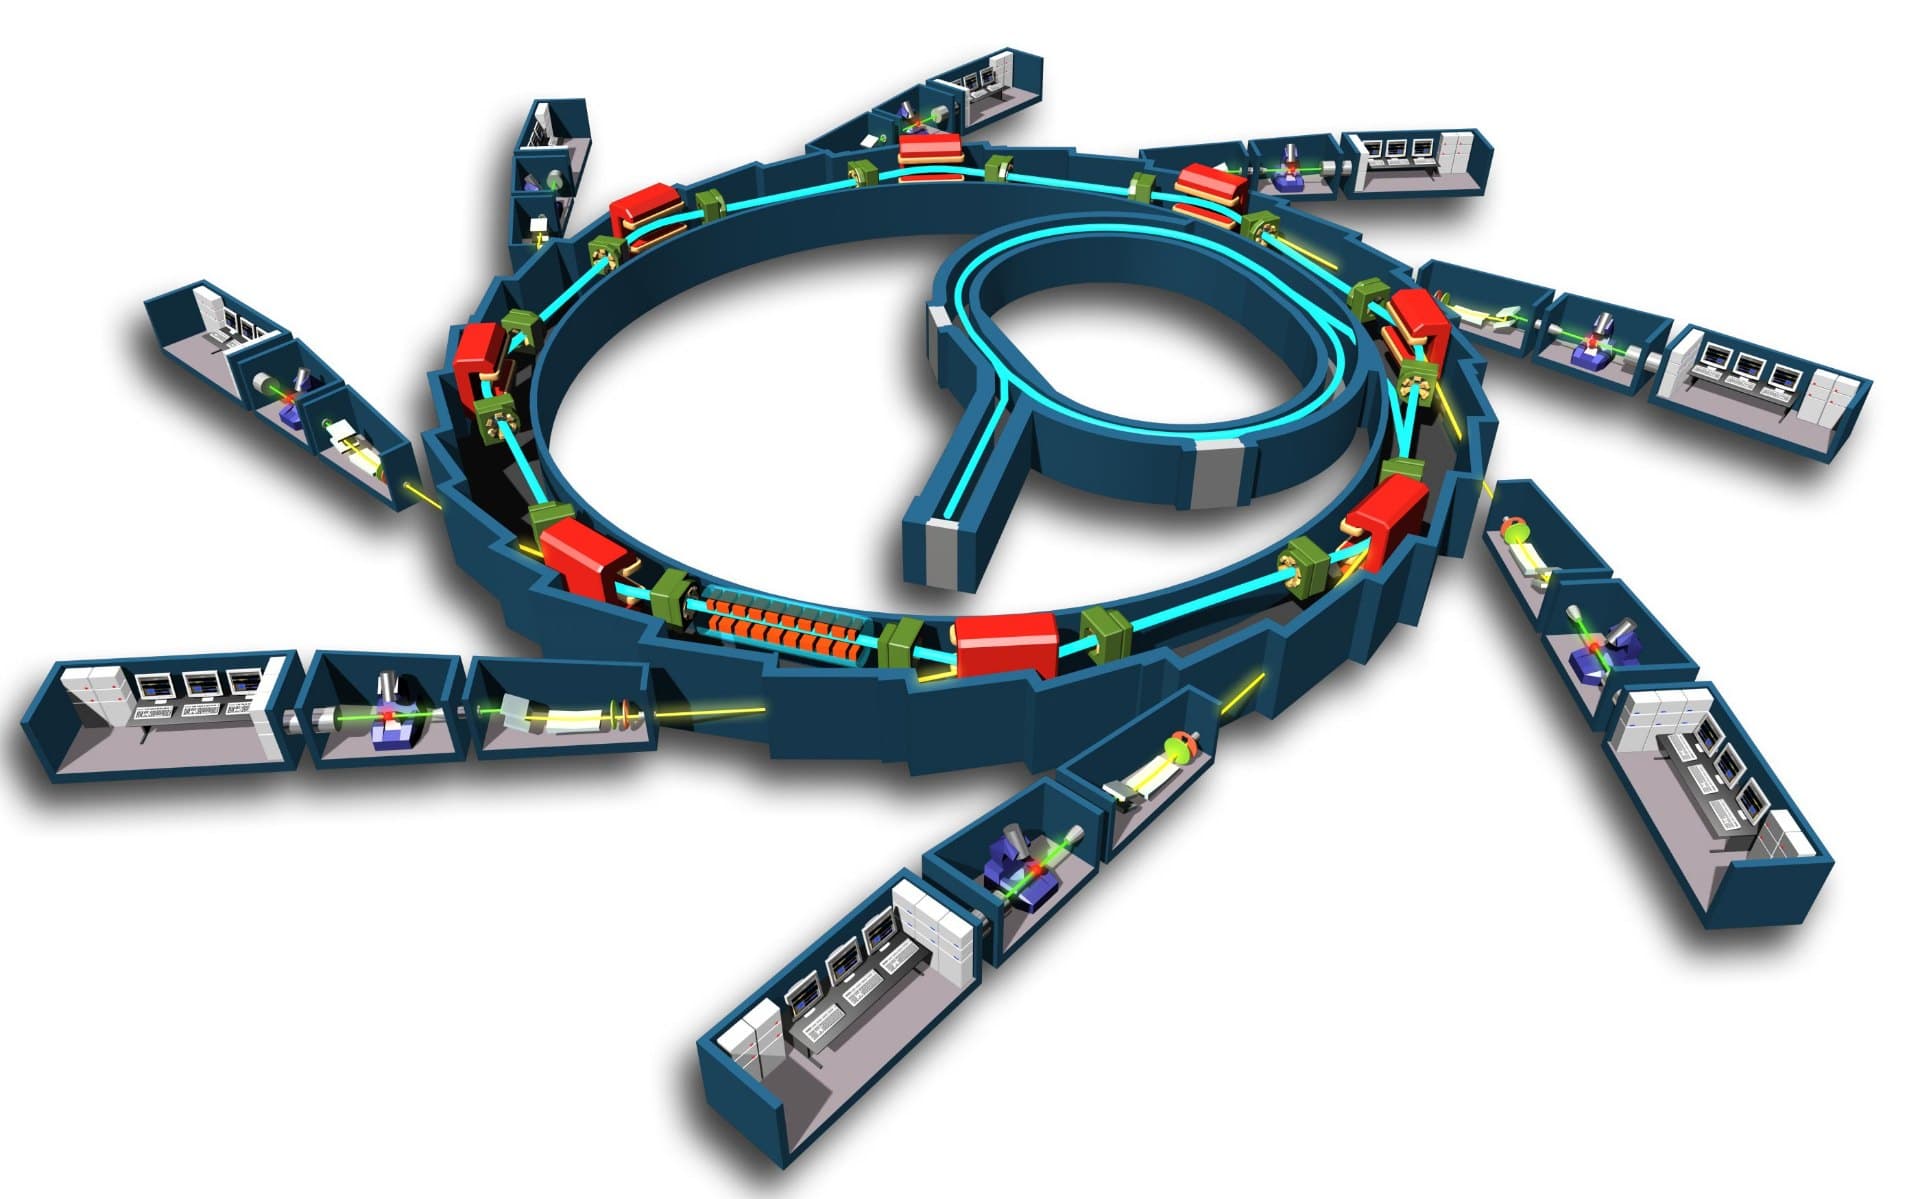
A synchrotron is a particle accelerator built to produce X-rays. Electrons circulate in a storage ring hundreds of metres around, and each bend of their path sends out a beam of X-rays into an measurement station, a beamline. There are a few dozen such facilities in the world, national or international, and none of them fits in a laboratory. We do not own one and we do not build one. We prepare the samples, book beamtime and measure with our beamline partners, who operate at these facilities. We do the analysis.
| Plainly |
|---|
| 01A facility, not an instrument: the ring is hundreds of metres in circumference |
| 02We book beamtime and measure with our beamline partners |
| 03X-rays far brighter than any laboratory tube, so a sample takes seconds |
| 04We do the analysis, on Mintti, our own system |
02 Process
From powder to report
You send ground samples. We prepare them, measure them at the beamline with our partners and quantify the mineralogy on Mintti, our own analysis system. Every sample comes back as a phase table with the evidence behind it, and the campaign as a written interpretation connected to the question you asked, reviewed together with you.
| What happens |
|---|
| 01Scope and beamtime scheduled as one project |
| 02Sample preparation for the beamline handled by us |
| 03Measurement with our beamline partners, phase identification and quantification on Mintti |
| 04Review with you, then Excel and PDF deliverables with a written interpretation |
Samples received
Day 0
Pulps arrive. Scope and beamtime are already agreed as one project.
Sample preparation
Days
Around 1,000 samples a day by hand, with more hands for large campaigns. Runs while we wait for the beamline slot.
Beamtime
Booked in advance
The calendar variable. Your campaign goes into the next available slot.
Measurement
A day, or a few
Up to around 8,000 to 10,000 samples a day, with our beamline partners.
First results
Within a day
Phase identification and quantification on Mintti, typically within a day of the data arriving.
Review and final report
Days
Our expert reviews every result, then we go through them with you. Excel and PDF with a written interpretation.
ΣTypically around five weeks end to end. Most of it is waiting for the booked beamtime.
03 Method
Why the data is better
Four things decide the quality of a diffraction pattern: how bright the beam is, how it passes through the sample, how the sample is presented, and how it was ground. At a synchrotron all four are on our side. The beam is orders of magnitude brighter than a laboratory tube, so the pattern is collected in seconds with a signal-to-noise ratio a laboratory cannot reach. The X-rays are hard enough to pass through the sample, so the pattern is measured in transmission and every grain in the aliquot contributes, not only the surface. The holder is kept in motion during measurement, which averages out preferred orientation, the platy-mineral problem that skews laboratory results. And grinding matters: in our Luolamäki validation set, ball-milled samples fitted with about half the spread in fit quality of mortar-ground ones.
| Four factors |
|---|
| 01Brightness: seconds per pattern, signal-to-noise a laboratory tube cannot reach |
| 02Transmission: hard X-rays pass through the sample, the whole aliquot is measured |
| 03Motion: the holder moves during measurement, suppressing preferred orientation |
| 04Grinding: finer, more uniform powder gives tighter fits across a whole set |
04 Capabilities
What synchrotron resolution reveals
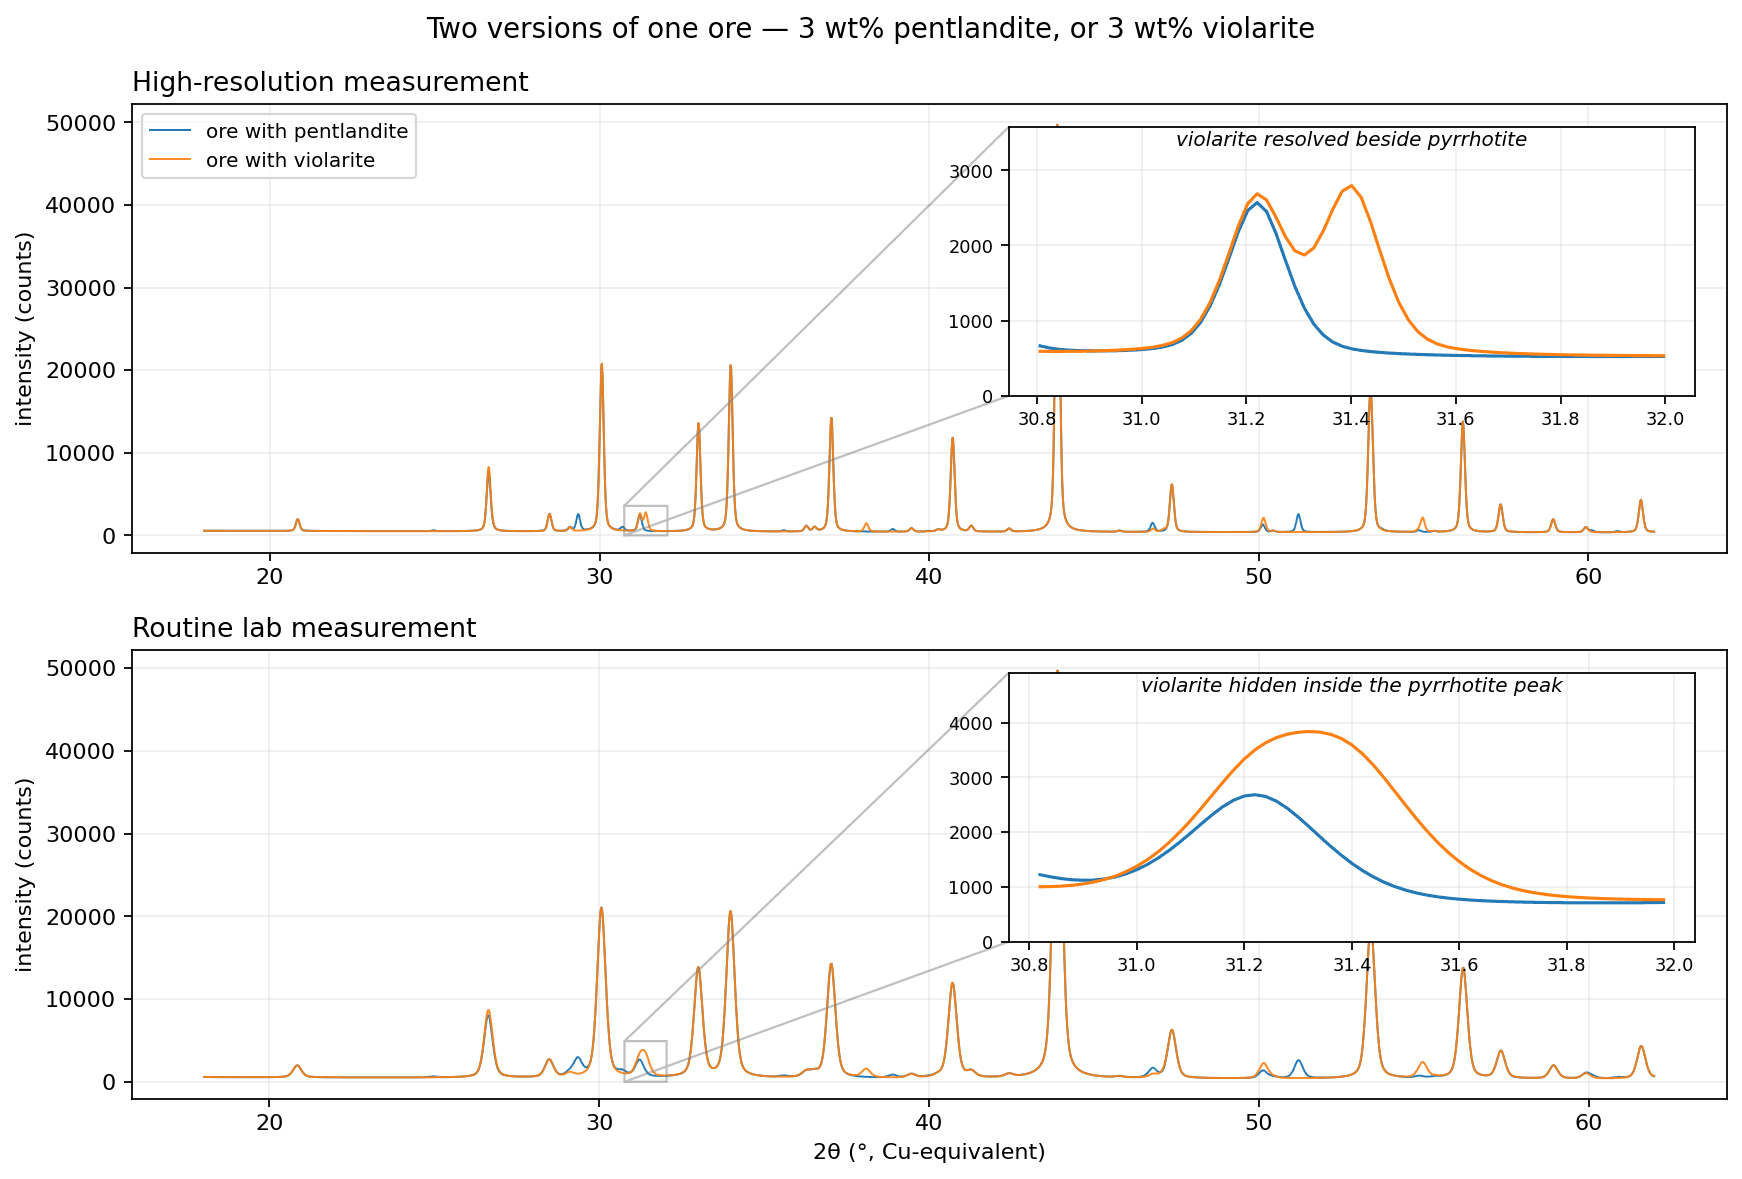
Synchrotron radiation is orders of magnitude brighter than a laboratory source, with angular resolution that separates peaks a diffractometer blurs together. Minor, poorly crystalline and overlapping phases become identifiable and quantifiable. Samples are kept in motion during measurement, which suppresses preferred orientation.
| Resolved and quantified |
|---|
| 01Trace and minor phases |
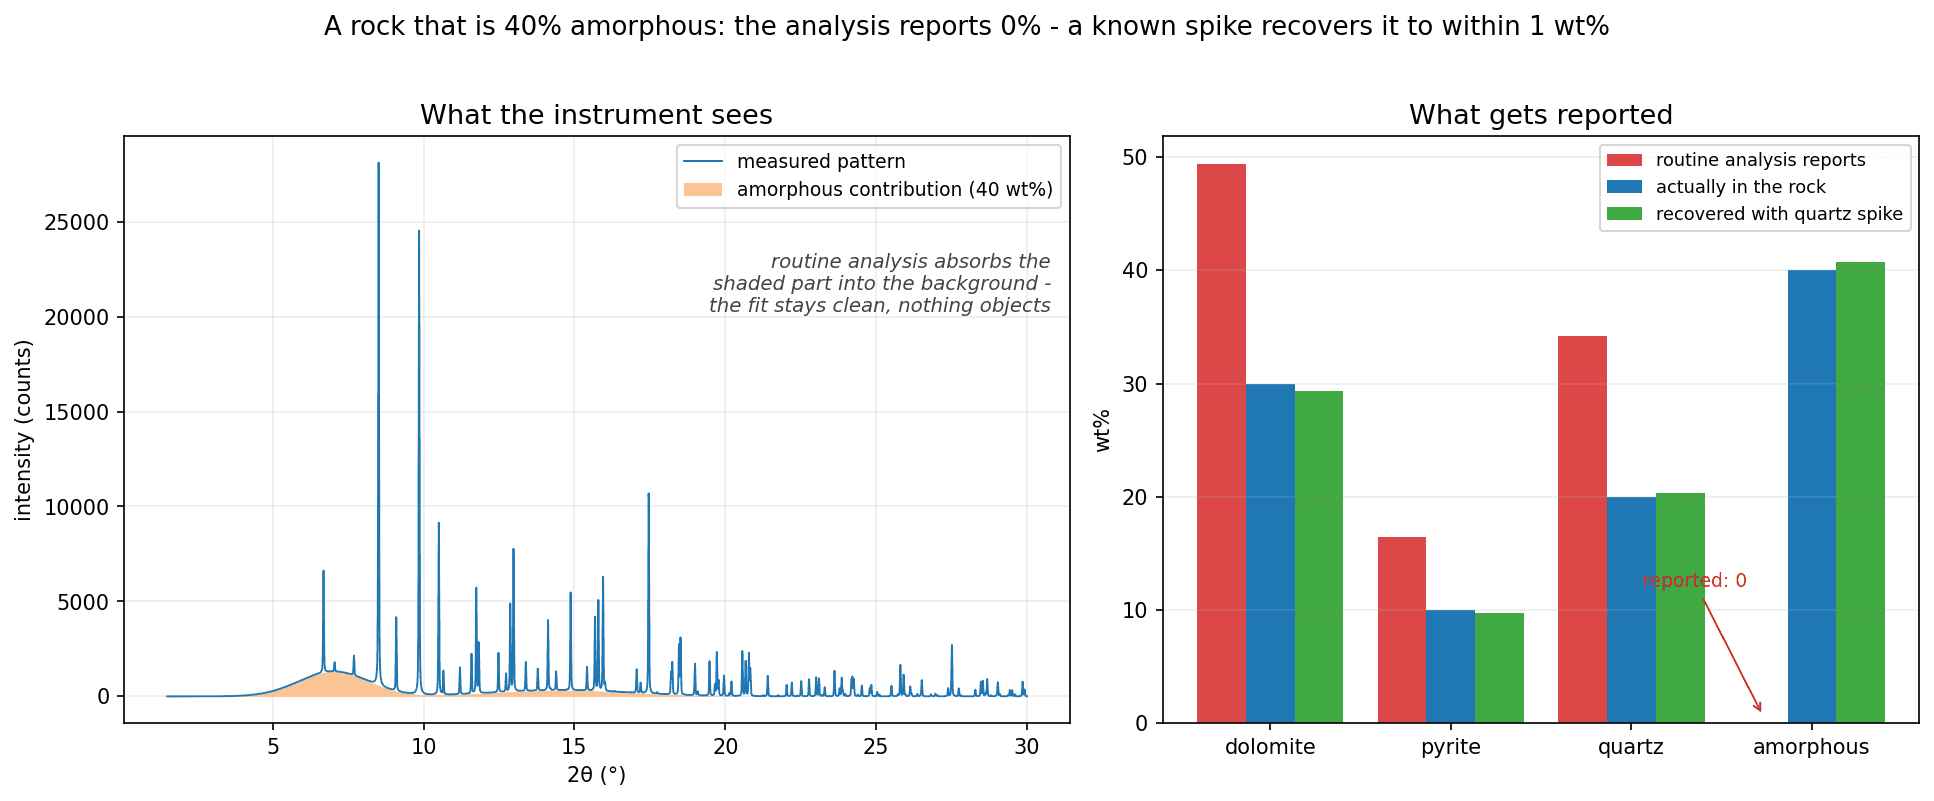
| 02Poorly crystalline and amorphous material, quantified with PONKCS and internal standards |
| 03Overlapping peaks and polymorphs |
| 04Complex assemblages with many phases |
05 Mintti
Mintti, our analysis system
Mintti is our own analysis system. Automated phase identification is possible because synchrotron data is precise enough to tell phases apart. Where the data alone cannot decide, Mintti applies mineralogy and geology: which minerals are viable and likely in the region, which occur together. Every decision is logged as evidence, whether it came from the automation, from an analyst's adjustment, from an A/B test or from a hypothesis run across the whole set. Quantification is by Rietveld refinement, fast enough for thousands of samples in hours through parallel computing, optimised algorithms and the right hardware, including high-end GPUs. An expert mineralogist reviews every result before it goes out.
| What it does |
|---|
| 01Identifies phases automatically from the diffraction data |
| 02Applies mineralogy and geology where the data alone cannot decide |
| 03Logs the evidence behind every decision, automated or manual |
| 04Runs hypothesis tests across the whole set: is mineral X present, sample by sample |
| 05Quantifies by Rietveld refinement, in hours for thousands of samples |
06 Accuracy
Results you can audit
Quantification is by full Rietveld refinement on Mintti. Phase identification is deterministic and auditable: each assignment is supported by pattern fit, paragenetic viability and regional mineral likelihood, not by an analyst's preference, and the reasoning is logged. We back-calculate the chemistry from the mineralogy so you can compare it with your assays. Our validation on about 350 drill-core samples from a lithium pegmatite deposit, checked against published assays, is being published as its own page.
| Delivered with every sample |
|---|
| 01Quantified phases with confidence metrics and intervals |
| 02Full Rietveld refinement with fit and residuals |
| 03The evidence behind each phase selection |
| 04Back-calculated chemistry for comparison with assays |
| 05Hypothesis testing across the whole set: is a specific mineral present, sample by sample |
| 06Reviewed by an expert mineralogist before delivery |
07 Economics
Mineralogy for the whole programme
At the beamline the marginal cost of one more sample is seconds of beamtime. Setup and scheduling dominate small batches, so the per-sample price falls sharply with campaign size. The budget that buys a handful of laboratory XRD samples buys mineralogy for every pulp in the programme, and the decisions that follow are made on measured mineralogy instead of a few samples and chemistry. Trial batches of 10 to 100 samples are offered subsidised, so you can compare against your current laboratory before committing a programme.
| How the economics work |
|---|
| 01Marginal cost per sample is seconds of beamtime |
| 02Per-sample price falls with campaign size |
| 03Every sample in the programme, not a selection |
| 04Subsidised 10 to 100 sample trials |
FAQ
Frequently Asked Questions
- What is Mintti?
- Mintti is our own analysis system. It identifies phases automatically because synchrotron data is precise enough to tell them apart, applies mineralogy and geology where the data alone cannot decide, and logs the evidence behind every decision. Quantification is by Rietveld refinement, fast enough for thousands of samples in hours. An expert mineralogist reviews every result.
- What do I need to send, and how much?
- Ground powder, as it comes from your sample preparation. Send what you have: 10 g of pulp per sample is a comfortable minimum, so there is material for repeats and for returning to you. The measurement itself uses milligrams. We accept pulps rather than whole rock.
- How long does it take?
- Sample preparation and analysis each take days, and measurement a day at the beamline. Beamtime is booked in advance, so the calendar is set mainly by the next available slot: from samples received to results delivered is typically about five weeks.
- How many samples can you handle?
- Campaigns of thousands of samples are routine and tens of thousands are practical. A 50,000-sample programme is about a week at the beamline. Measurement runs at up to around 8,000 to 10,000 samples a day, preparation at around 1,000 a day and scales with people, and Mintti quantifies thousands of samples in hours, so first results typically arrive within a day of the data. Trial batches of 10 to 100 samples are offered for comparison against your current laboratory.
- What about amorphous or poorly ordered phases?
- Synchrotron data resolves poorly crystalline material considerably better than laboratory XRD. Where amorphous content matters, we quantify it with PONKCS and internal standards.
- How do you know the results are right?
- Every result carries its evidence. Each phase is chosen on pattern fit, paragenetic viability and regional mineral likelihood, and the reasoning is logged. Every percentage comes with a confidence interval and the full Rietveld fit and residuals. We back-calculate the chemistry from the mineralogy so you can compare it with your assays. An expert mineralogist reviews every result before delivery.
- Can you analyse samples from any geographic region?
- Yes. We accept samples from anywhere in the world. Results are delivered digitally.
- Do you also analyse XRD data we already have?
- Yes. Phase identification and Rietveld quantification from your own laboratory XRD data is available as a secondary service.
- How does SR-XRD compare with QEMSCAN, MLA or TIMA?
- They answer different questions. Automated SEM mineralogy (QEMSCAN, MLA, TIMA) images particles and reports liberation, grain size, associations and texture, which XRD does not see. XRD reads the crystal structure of the whole sample and reports the modal mineralogy: which minerals, and how much of each, including polymorphs and lookalikes with the same chemistry, and the amorphous fraction when a standard is added. SR-XRD does that at seconds per sample, so it covers every sample in a programme where automated mineralogy covers a selection. In practice they are used together: SR-XRD for the mineralogy of the whole set, automated mineralogy for liberation and texture on the samples that need it.
- Is synchrotron XRD expensive?
- No. Pricing is competitive, also on smaller sample sets, and quoted per project. At the beamline the marginal cost of one more sample is seconds of beamtime, so the per-sample price falls with volume. A first batch is priced so that comparing us with your current laboratory is easy.
Tell us about your samples
Whether it is a trial batch or a drilling program, we would like to hear what you are working on.